
Whether you’re doing content marketing in-house or as an outside consultant, you’re inevitably going to have executives (or whoever’s in charge) ask you, “What’s our ROI from content?”
Or, if you’re just beginning your content marketing efforts, “What can we expect our ROI from content to be?”
Over the last 5 years of doing content marketing for over 30 companies, we’ve learned that most content marketers and agencies don’t know how to answer these questions. So when we first started our agency, this was one of the first challenges we set out to solve.
We realized that if we were able to prove the value of our content, we would a) have a massive advantage over other agencies who don’t typically report on ROI and b) be able to keep clients over the long-term.
In this post, we’re going to walk through the exact process we use to track and show ROI to our clients. At each step, we’ll explain what people normally do wrong, and what you can do instead to measure ROI correctly.
We’ll also provide an ROI calculator—a spreadsheet template modeled after the ROI sheets we create for clients—that you can copy and use yourself.
Below, we’ll cover the process in 4 steps:
- Define a business metric that people who are asking care about (hint: it’s not traffic)
- Set Up Google Analytics to measure conversions for that metric
- Calculate the number of leads per month it’ll take to break even on your monthly spend
- Plot your monthly conversions to track your progress
But before all that, we’ll first discuss some misconceptions about what content marketing ROI actually means and how to define it.
Note: Broad definitions of content marketing include many different digital marketing channels and types of content—video, podcasts, email marketing, etc. This post focuses specifically on ROI from blog content marketing.
What Is Content Marketing ROI? (And How We Define It Differently)
When you search “content marketing ROI” in Google, nearly every article provides the same ROI formula:
( [Return – Investment] / Investment ) x 100 =
Content Marketing ROI %
But nobody—literally not a single person, CMO, CEO, etc.—has ever asked us for a percentage ROI calculation. People don’t think in these terms when it comes to measuring the ROI of content marketing.
In our experience, when executives ask, “What’s our ROI from content?”, what they really want to know is a few practical things:
- How much business (e.g. leads and sales) can we generate from this channel?
- How long will it take until we break even?
- How long until we start making money?
- How much total spend will it take before breakeven?
Answering the first question—“How much business can we generate from this channel?”—is a matter of understanding the total number of keywords in your space that have business value.
In general, content marketing has great upside because it’s leveraged for search engine optimization (SEO), which, unlike paid channels, doesn’t require continued spend to keep getting traffic and leads.
When you produce SEO content that ranks high enough (usually top half of the first page) for its intended keyword, that content keeps generating leads as long as it’s ranking. As you pile on more and more first page rankings, your number of leads from content continues to increase. So, as long as you have a decent number of keywords to tackle in your space, content can produce great returns over the long term.
Understanding and being able to show this to the people who ask about ROI is what convinces them they can deal with the initial trough where you’re spending more money than you’re getting in return.
Answering the second two questions—how long and how much spend it will take before you become ROI positive—is what the process we describe below will help you figure out and explain to key stakeholders.
It starts with defining a metric that has actual business value, which most content marketers don’t do.
Step 1: Define an Actual Business Metric to Measure
There’s a tendency for content marketers to measure “vanity metrics”—metrics that look or sound important but can’t be directly attributed to lead generation or sales.
To be blunt, that tendency, in our opinion, stems from the fact that it’s easier to make these vanity metrics go up than harder things like revenue or leads generated.
Examples of these include:
- Overall website traffic
- Blog page views
- Email newsletter signups
- Webinar signups
- Organic traffic
- Brand awareness (how do you even measure this?!)
- Social media engagement (e.g. “We’ve seen a lot more comments on LinkedIn!”)
- Bounce rates
- Click-through rates
Don’t get us wrong, measuring some of these metrics can tell you if you’re headed in the right direction, but if the metrics you’re measuring can’t be directly attributed to sales, you can only make vague assumptions about actual ROI.
As we’ve outlined in many past pieces (like this one), it’s very easy to, for example, produce content that generates a lot of traffic but very few or no leads.
For example, we once had a client with an app in the survey and customer feedback space aimed at marketers and product people. They were ranking near the top for the keyword “likert scale”—which is an academic term around a particular surveying method—and getting a ton of traffic from it.
Needless to say, they got zero or nearly zero signups a month from it—the vast majority of people researching what a “likert scale” is aren’t in the market for a customer surveying app. The management team mentioned more than once that they had big blog traffic growth goals. This keyword was obviously helping them hit those goals—but what business value were they getting from it? Nearly zero.
The first step to measuring your return on investment is to choose a content marketing metric that actually has business value.
In our experience, for the vast majority of companies, this metric will be in one of these 3 buckets:
- Qualified leads for any business using a sales team.
- Free trial signups or booked demos in SaaS.
- Purchases in eCommerce and direct to consumer businesses.
That’s basically it.
If you want buy-in from people asking about the ROI of your content, you need to track and report on one of these key performance indicators (KPIs) that tie directly to revenue.
The Elephant in the Room
You might be wondering, “Why isn’t this the standard procedure for measuring content performance?”
It’s because most consultants, agencies, and businesses don’t use a content marketing strategy that would even generate ROI in the first place.
This is the problem underneath the tendency to report on vanity metrics. Most content that companies produce doesn’t actually drive revenue, so most content marketers wouldn’t have these results to report on even if they knew how to track them (which many don’t).
So, it’s not in their interest to report on a meaty, useful metric like leads generated, it’s far easier to use “social shares” or simply overall traffic as a metric of success (or, worse, output metrics like number of articles published or word count).
We’ve written about this extensively, so we won’t go deeply into it here. You can read this article to understand what we mean.
The bottom line? You need a content strategy that will actually attract potential customers, specifically those that are ready to buy (or sign up, request a demo, etc.). And to do so, you need to focus on bottom-of-the-funnel topics and keywords first because that’s where the majority of actual leads and sales will come from.
Note: If you’d like to learn our content strategy and apply it to your business, we teach everything we do and give personalized feedback in our content marketing course and community.
Step 2: Set Up Google Analytics to Measure That Metric
[su_note] Note: With the sunsetting of Universal Analytics (UA) and the introduction of Google Analytics 4 (GA4), the content of this section on creating conversion goals and setting up the Model Comparison Tool to measure conversions in GA is now outdated. We’ve written a new step by step tutorial on how to set up conversion tracking in GA4 which you can read here.[/su_note]
Once you’ve defined the business metric you’ll use as your benchmark for content performance, you need a way to measure it.
For this, we use Google Analytics (GA). We do this (specifically the exact reports we are about to outline in this section) for all of our agency clients and we find this works well because Google Analytics is ubiquitously used. That said, you can get similar data from marketing automation or other analytics tools like HubSpot, Pardot, or even home built tools, which we also use for clients that have those.
In GA, the instinct that many marketers have—and the way most blogs explain how to do this—is to use the Behavior > Site Content > Landing Pages report.
However, this report is insufficient because it only measures conversions where a user lands on a blog post at the beginning of a session, and then converts within that same session.
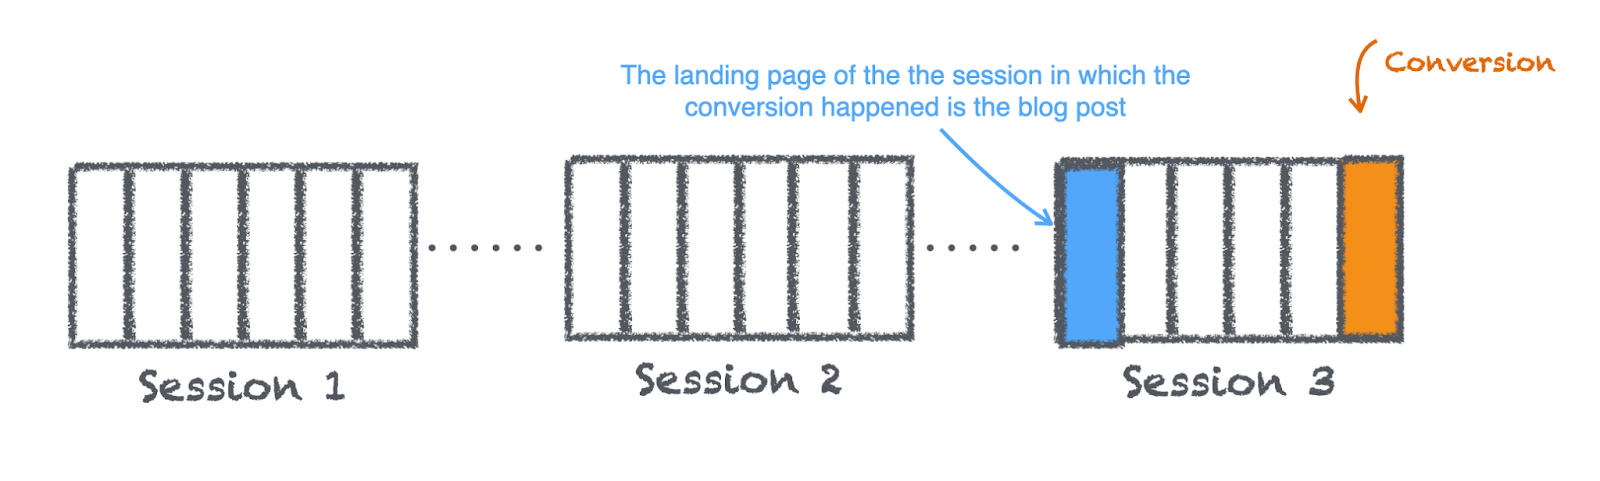
This is a visual model of how Google Analytics thinks about visits to a website. It views visits as grouped into “sessions” which is a continuous use of a website. If the user closes the tab or is idle for 30 min and returns, that’s a new session. GA calls the first page within each session the “Landing Page”.
So, if your blog post is ranking for “best X software”, and someone types that into Google, clicks on your blog post, reads it, and then comes back and converts a few days or weeks later—you wouldn’t get credit for that conversion.
But you deserve credit for it. This is what content is supposed to do.
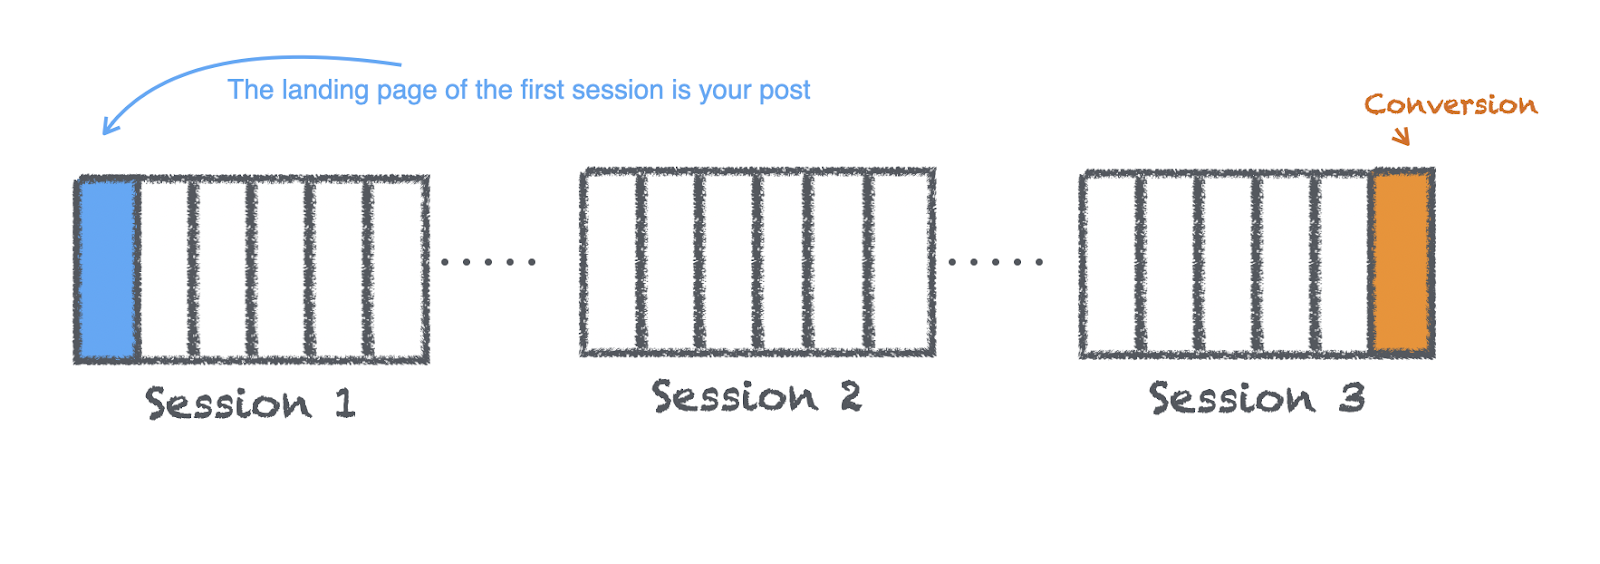
For most products, some fraction of customers will require multiple touches and sessions before they convert. Therefore, you need a way to measure conversions where someone’s first session on your site was your blog post, and then they come back and convert at some later time.
In the visual model of GA’s “sessions”, we mean you need a way to get credit for this scenario:
For this, we use Google’s Model Comparison Tool. Here’s a quick tutorial on how to set this up.
Create a Google Analytics Goal for That Metric
There are 2 types of goals that we use for clients that will work for you for this purpose:
- Destination goal: You create a unique “Thank You” page for people who sign up, submit a form, and have that be a goal in GA. We describe this in detail in this article.
- Event Goal: For situations where you can’t create a unique page for people to reach when they “become a lead”, you can instead create an event in GA attached to any user action on your website. For our purposes, these actions are most often something like clicking the “submit” button on a web form, completing a free trial signup, and so on.
Creating an event usually requires a developer because you need to add GA’s event code snippet to the button or form you want to track, so you first have to get into your website’s code. So ask your developer about this, but you can also familiarize yourself by reading this page about how GA events work.
Here is a developer-facing page with the code your developers need to add for your event that you can send them.
Note: GA events need a “category” and “action” label associated with them. Just name those whatever makes sense to you. We typically don’t use the “label” or “value” fields for events.
Once you set up the event, you can create a new goal that counts every time that event happens. In the goal setup process, select “Custom,” give it any description you want, select “Event,” and type in the category and action exactly as the developer did when implementing the code (note that this is case sensitive):
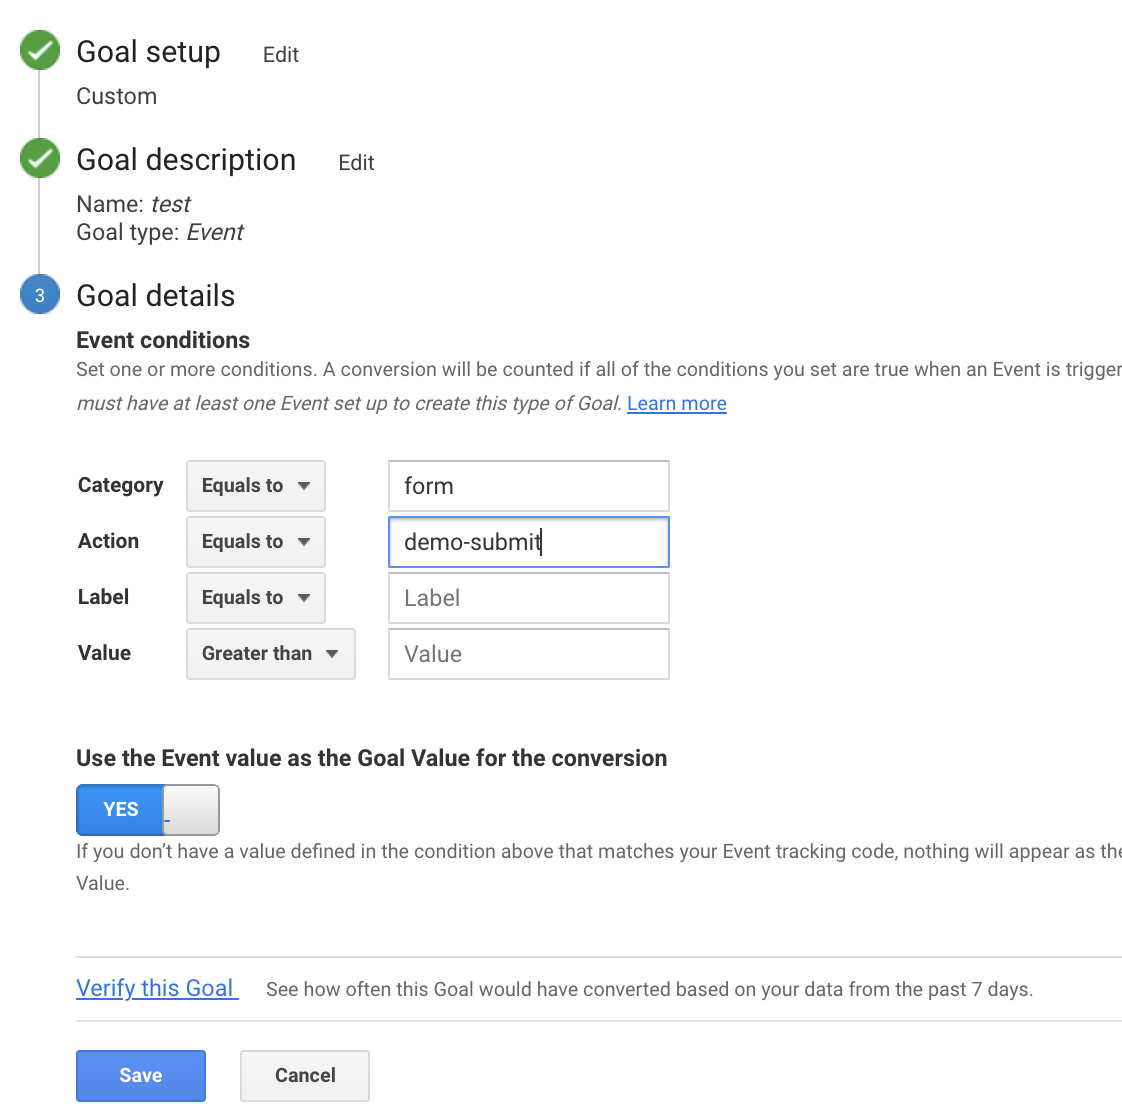
Set “YES” on making the Event value the same as the Goal Value (since you’ll likely keep the event value blank, it will just record a “1” whenever the event fires).
Set Up the Model Comparison Tool to Track Goal Completions from Your Content
Our article on content attribution models covers how to set up the model comparison tool (MCT). You can follow that process to set this up for yourself.
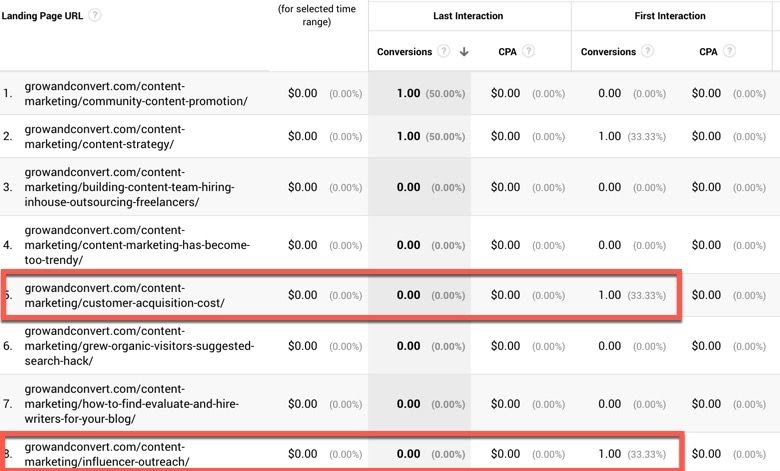
Once your MCT is set up, be sure to run a test to ensure it’s working. Simply open up an incognito window, paste the URL of a blog post into your browser, complete the conversion action, and look at your MCT the next day to see if it registered.
If it’s working, you’ll see a last interaction conversion for the URL you ran the test with.
When this is complete, conversion tracking for your content marketing campaign is set, and you’re ready to begin the process of measuring your ROI from content.
Step 3: Calculate the Number of Leads or Sales per Month Needed to Breakeven
Assuming you’ve done the steps above, you now have a way of measuring leads attributed to each piece of content that you publish.
Now, we can start doing some calculations on how many conversions we need to get to ROI breakeven. Our method below involves doing some simple back of the envelope calculations on how much deals and leads are worth and how that compares to how much you spend per month on content marketing.
This works slightly differently depending on whether you’re measuring leads or sales, so we’ll explain both here.
To calculate this when your goal is leads, you need three numbers:
- Annual value of a closed deal: On average, how much a closed deal is worth to you over the course of the first year.
- Lead to close rate: The percentage of leads who become closed deals.
- Cost of content marketing: Your agency/consultant spend, or the portion of your marketing budget that pays your content marketing team (plus the tools they use, etc.).
You can multiply the first two numbers to get your average value of a lead, which you can use to figure out how many leads per month you’ll need to break even based on your spend.
Here’s an example to demonstrate:
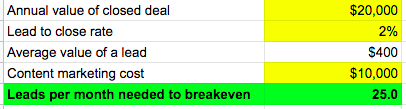
If your annual value of a closed deal is $20,000, and on average, you close 2% of those leads, then, by multiplying those numbers together, you’d get an average value of a lead worth $400.
Then, to see how many leads per month you need to break even, you simply divide your monthly content marketing cost by your average value of a lead.
In this case, based on a $10,000 per month cost (what we charge at our agency), the business would need 25 leads per month to break even.
Note: The alternatives to using the annual value of a closed deal are to use a monthly or lifetime value. Monthly value is, in our opinion, an unreasonably short payback period for content, and lifetime value (LTV) is too long (no one wants to wait three to five years to begin making money on a customer). So, we use the annual value of a closed deal because for most B2B businesses, one year is generally considered a reasonable amount of time to recoup their investment in acquiring a new customer.
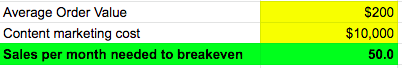
If you’re an eCommerce or direct to consumer business, and the business goal you’re measuring is sales, the calculation is simpler. Instead of using the annual value of a closed deal and your lead to close rate, you just use average order value (AOV)—the average dollar amount of a purchase on your site—and divide that by your content marketing cost.
So, if your AOV is $200, and your content marketing cost is $10,000 per month, on average you’d need 50 sales per month to break even.
With your MCT set up to track conversions, and your benchmark number of leads or sales per month needed to break even, all that’s left to do is to plot your monthly conversions on a graph to track where you are in relation to that goal.
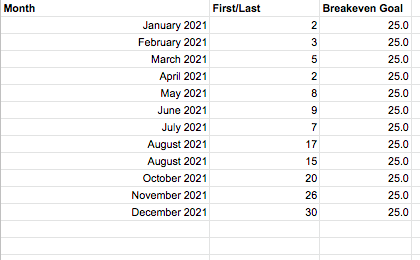
Step 4: Plot Your Monthly Conversions to Track Your Progress
Create a section in your ROI spreadsheet to record monthly first and last click conversions from your MCT. Here’s how it looks in the sheets we create for our clients:
Then, create a line chart alongside that and plot two lines—one for your conversions, and one for your break even goal:
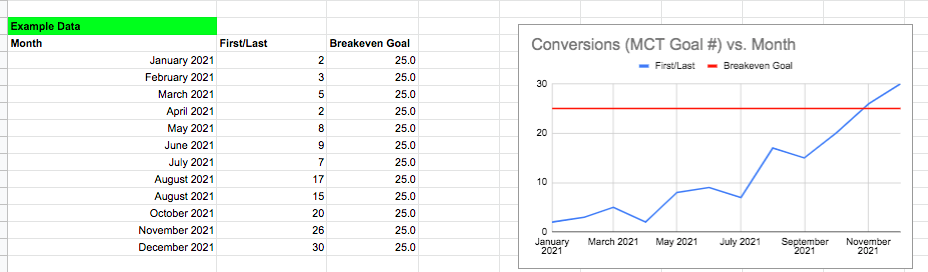
Yeah, that’s a nice looking graph. This is just example data and most content marketing graphs won’t look like this. However, by following the strategies we teach on our blog and in our course, this type of growth is possible. We’ve seen it with some of our clients. For example, with Circuit (view case study here):
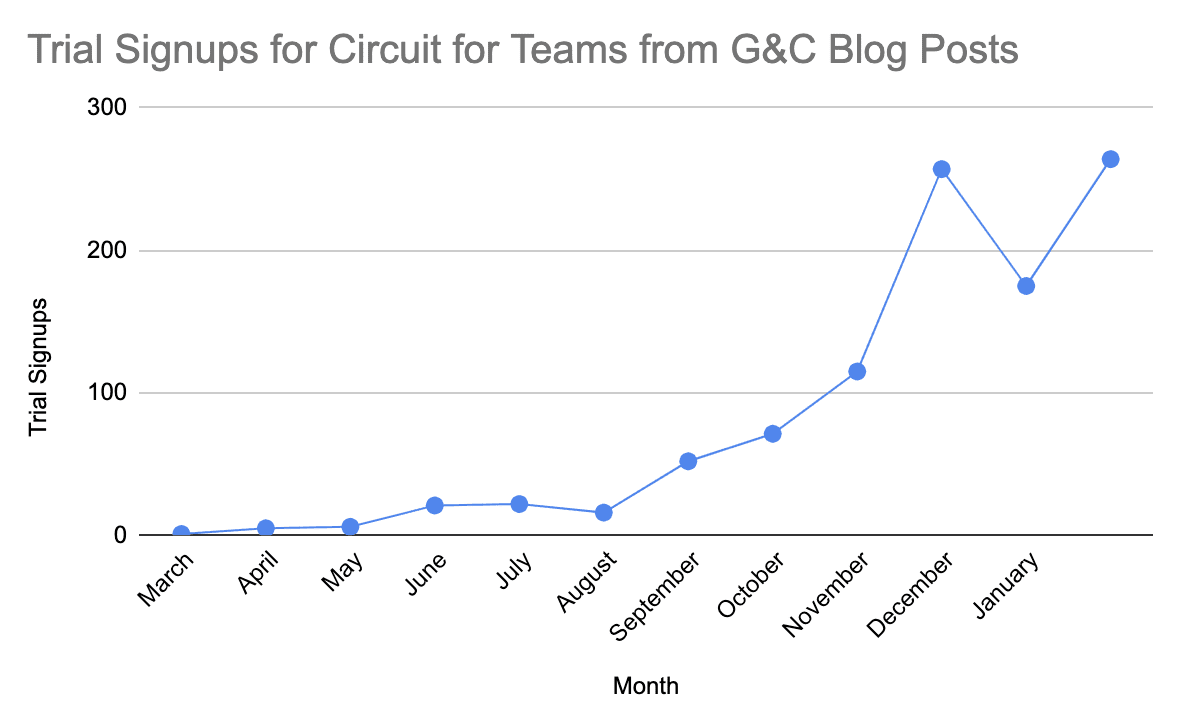
Then, notice what you can see clearly in this graph:
- Where you’re at now in relation to your break even goal.
- Your progress over time in relation to your break even goal.
- The pace at which you’re approaching your break even goal.
- The point at which you begin meeting or exceeding your break even goal.
- How much you’ve spent on content marketing to date.
With this in hand, when executives or clients ask, “What’s our ROI from content?”, you can actually answer them in a way that practically fits what they want to understand.
In our experience, once businesses can see they’re making money from the channel, they’re happy. The real challenge is maintaining their buy-in during the time it takes to meet and exceed that break even point.
For more on this, check out our article: How Long Does It Take for Content Marketing to Work? A Case Study
Also see our latest post: How Long Does It Take to Rank on the First Page of Google?
How to Download and Use Our Content Marketing ROI Calculator
To use the ROI calculator we’ve created for you, click here to open up the Google Sheet.
Then, click File > Make a Copy to title and save your own editable version of the template.
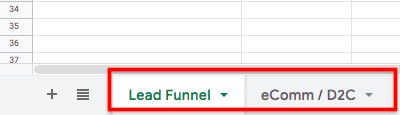
There are two sheets. One for B2B marketers measuring leads, and another for eCommerce and direct to consumer businesses, which you can see at the bottom of the document:
In addition to the calculator, we’ve also included a section that helps you see how much traffic you’d need to hit your break even goal (based on different conversion rates):
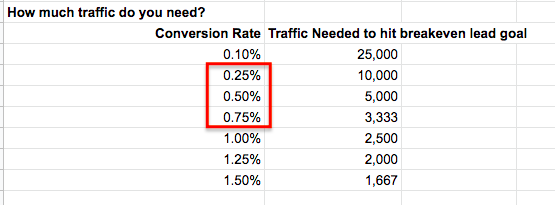
Conversion rates for individual pieces of content will vary widely, but in our experience, most of our clients have average blog conversion rates in the range of 0.25% to 0.75%.
However, this assumes you’re focused on creating high-quality content for bottom-of-funnel purchase intent keywords, per our Pain Point SEO strategy. If you’re using a top-of-funnel strategy to reach your target audience earlier in the customer journey (e.g. creating ultimate guides, infographics, etc.), conversion rates will likely hover more in the 0.10% range.
If you’d like to learn how to attribute leads to content with video examples, we also share this process and more, in our course and community. If you’d like us to do content marketing for you, then feel free to fill out the form on the bottom of our work with us page.
Questions? Comments? Feel free to share them in the comments below and we’ll respond.
Join the Grow and Convert Newsletter
Get our marketing ideas emailed weekly.
Explore Articles By Categories


Explore our Videos